Kevin Felix

Data-driven professional making data digestible.
Rubik's cube solver, cat lover, and fan of anything DC Comics!
View My LinkedIn Profile
SQL Portfolio
Massachusetts Education Analysis
.png?raw=true)
Intro
I’m someone who was raised in Las Vegas, Nevada and am fortunate to have experienced a pretty good education throughout my time in school. While I am proud of the things I learned and the education I received, I very much remember constantly hearing about Nevada ranking at the bottom of state education rankings. Even as I write this, Nevada remains in the bottom 10 states across the country. Although I know this is the case, I’ve never truly understood the factors that impact a state’s education proficiency.
Using Tableau, I analyzed and visualized data from various schools and districts throughout the Massachusetts area. The focus of the project was finding answers to the following questions made by the Commissioner of Education for the State:
- How does class size affect college admission?
- What are the top math schools in the state?
- What schools are struggling the most?
- What percentage of students are currently attending college?
Data Details
The following data was pulled from reports done by the Massachusetts Department of Education in 2017. Here is a link to the dataset for those interested. In this dataset I analyzed over 1,800 rows of data and the following columns were most relevant:
- graduation rates
- class size
- economic disadvantage
- college attendance
- 4th grade math test scores (P+A)
Key Insights
- While 83% of students in Massachusetts graduated high school, the lowest performing schools had graduation rates of 20% and below.
- The majority of students in Massachusetts are well prepared to succeed in Math subjects, with around 74% of 4th graders achieving Proficient (P) or Advanced (A) scores.
- On average, about 75% of students attended college in Massachusetts regardless of class size. While class size does not have a direct impact, there is a correlation between college attendance and economic disadvantage.
The Analysis
Does class size affect college attendance?
As part of this analysis, the Commissioner of Education wants to find whether there is a connection between class size and the percentage of students attending college. Based on the data from this Massachusetts Education report, the two do not have a strong correlation.
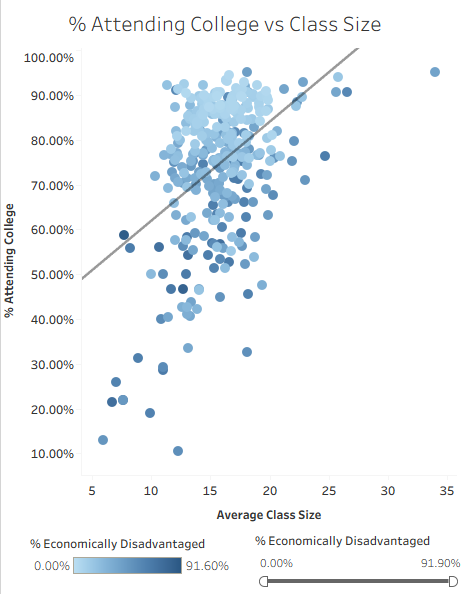
While I found a weak relationship between class size and college attendance, I did find that there is a notable relationship between economic disadvantage and college attendance. Represented by shades of dark blue (lower college attendance) and light blue (higher college attendance) in the scatterplot above, there is a strong negative correlation between the two variables. Schools with less economically disadvantaged students tend to have a higher percentage of students attending college. On the contrary, schools with a higher population of economically disadvantaged students tend to have a lower percentage of students in college.
Although the strong trend between those variables exists, there are some schools that are outliers. When filtering for the top 10 schools with an average of at least 50% economically disadvantaged students and an average of at least 75% students attending college, we see the following:
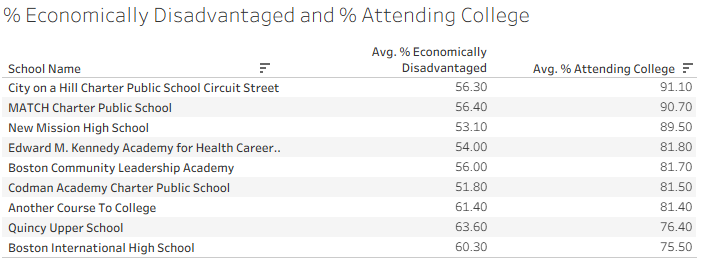
Identifying these schools could be incredibly useful for the district, as they can further investigate how these standout schools operate and learn from their success to help inform strategies that can be used at other schools. This knowledge could help other schools with high percentages of economically disadvantaged students increase their college attendance percentages.
Low Performance Schools
The Commissioner of Education wants to be aware of the schools that struggled the most in 2017, specifically by finding the schools with the lowest graduation percentages.
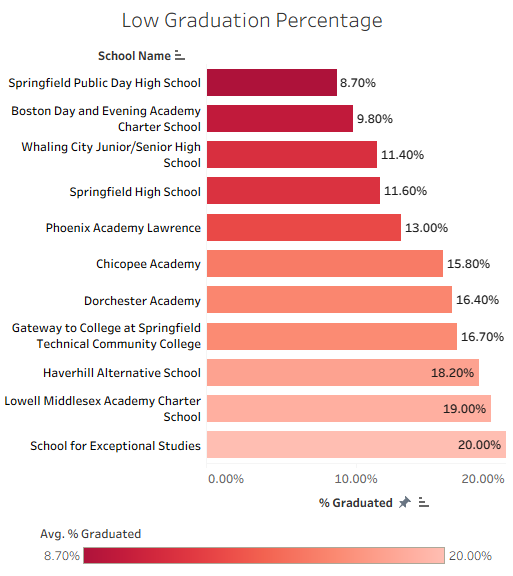
In the bar graph above, we can see that there are 11 schools with a graduation percentage of 20% or less. Interestingly, the majority of the schools that fall under this category are alternative schools that serve different groups of students with varying needs.
Going a bit further, I was curious about the amount of charter schools vs public schools that fell into the low graduation percentage group. As seen in the the graph below, 81% of the schools with a graduation percentage of 20% or below are public schools.
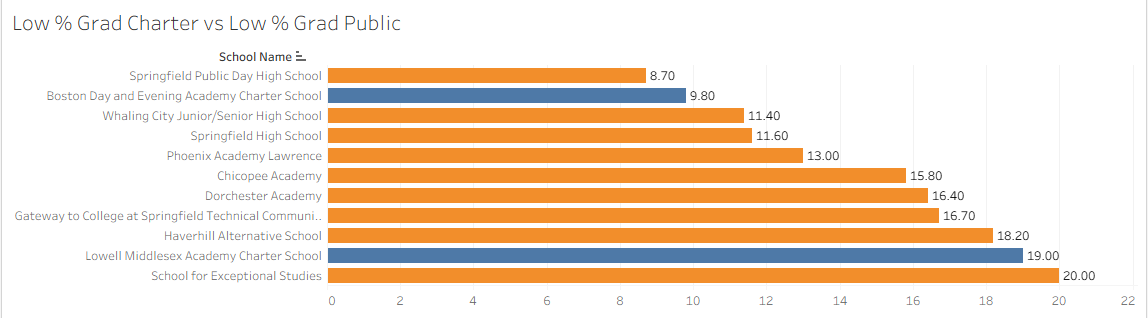
Even though these schools with low graduation percentages are all alternative schools, these findings could point the Massachusetts Department of Education in the right direction when it comes to assessing curriculums and teaching styles throughout the various schools.
Math Proficiency: 4th Grade Math Scores
According to the Massachusetts Commissioner of Education, 4th grade math scores are a key indicator of a student’s future success in the subject. The scores within the dataset are reflective of the grading structure established by the The Massachusetts Comprehensive Assessment System (MCAS) that categorizes students (grades 3-8) according to the following levels: Proficient (P), Advanced (A), Needs Improvement (I), and Warning (W). For the sake of this analysis, the focus is on a grouping of P+A (scores of at least 50%).
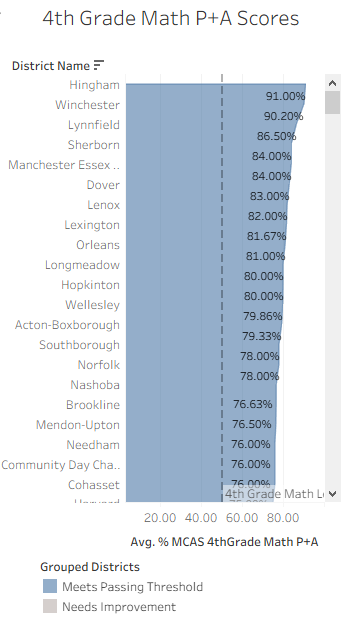
Given the quantity of districts within the dataset, it was important to present the information in a way that is easily digestible. I opted to use an area chart, along with an established parameter that allows stakeholders to quickly visualize what districts fall within which group (Meets Passing Threshold vs Needs Improvement).
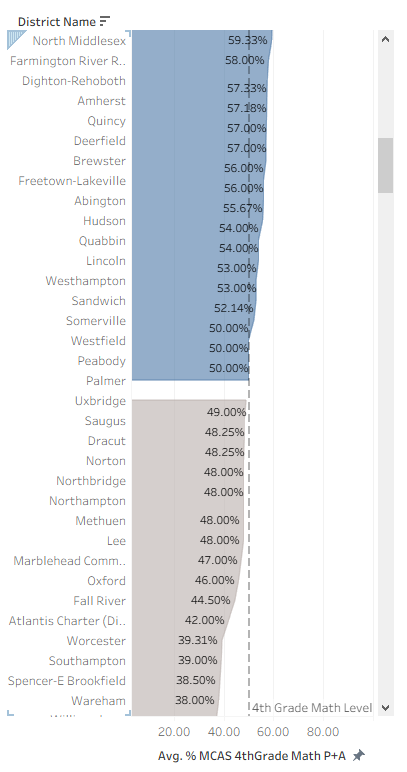
I found that approximately 25% of the districts are below the 50% average score threshold while approximately 75% of districts are at or above the threshold. Seeing the high quantity of districts that are above threshold is an indicator that the majority of Massachusetts districts are preparing students adequately for a successful future in the subject of math.
The district with the highest average was Hingham, with 91% of their students scoring a P or A in the MCAS assessment. The district with the lowest average was Tec Connections Academy Commonwealth Virtual School with 17% of their students scoring a P or A.
In this case, the two extremes are represented by a traditional school district versus a virtual school district. This is something that could be investigated further to understand if these specific factors had a significant influence on those averages. Nonetheless, the Massachusetts Board of Education could use these insights to guide funding strategies that can assist underperforming schools in the form of afterschool tutoring, specialized grants, and hiring more staff.
Key Takeaways
- While 83% of students in Massachusetts graduated high school, the lowest performing schools were 11 alternative schools that had 20% or fewer of their students graduate. Additionally, 81% of these low-performing schools are traditional public schools while the remaining two are charter schools. Further investigation into the appropriate curriculums and learning strategies necessary for these alternative schools could help increase graduation rates.
- Students in Massachusetts are well-prepared for statewide math assessments, with 75% of districts having average scores at or above the threshold of 50% (Proficient (P) or Advanced (A)). The Massachusetts Department of Education could improve the statewide average even more by assisting low-performing schools with a focus on specialized grants, workshops conducted by high-performing educators, increased afterschool tutoring programs, and more.
- While Massachusetts has a strong college attendance at a 75% average regardless of class size, there is a notable negative correlation between economic disadvantage and higher education enrollment, with a few outliers. This suggests that student success is predicted less by class size and more by socio-economic obstacles. These findings can help the state shift its focus from class size to resource funding when searching for ways to increase college attendance.
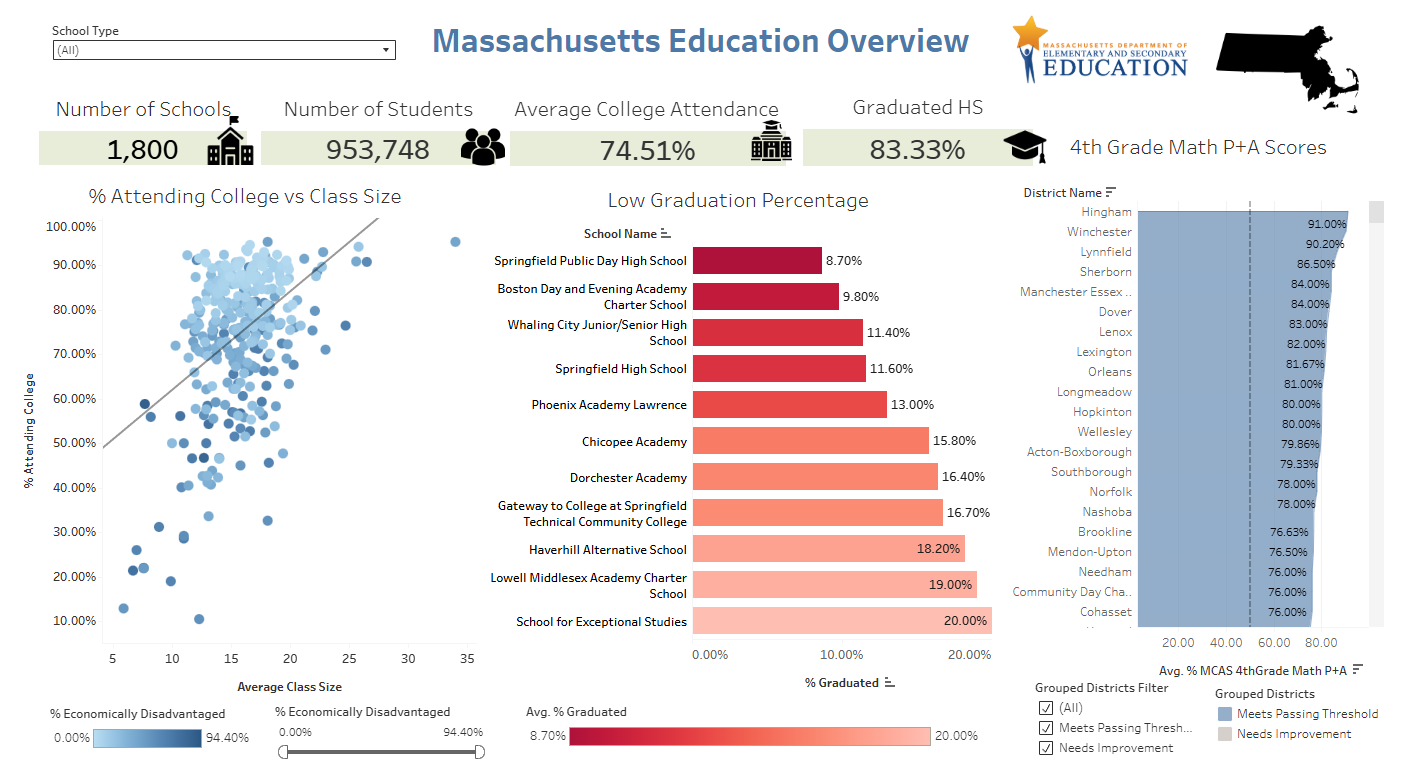
Closing Thoughts
Below is a static version of the Tableau dashboard I created where I compiled all of the visualizations seen throughout this analysis. For an interactive version, click this link!
Thank you for reading through my project, I appreciate you! I am actively working on projects and am always grateful for any feedback I can get as I progress throughout my data career.
Feel free to connect with me on LinkedIn with any questions or if you want to chat.